
Power Output Throughout Race

In recent posts I've explored race level weighted average power from top level riders. I've shown that power outputs are higher on tougher climbing stages, higher for riders in breakaways, lower on very hot race days, higher in one day races than stage races, and higher for higher placed riders. I've also dug into power output by rider types, showing that climbers have the widest spread between their max power output on climbing stages and their lowest power output on flatter stages.
Next I'm going to explore power outputs over the course of a race by exploiting power files for climbs throughout a race. I have over 15,000 unique rider/climb power files showing power output, gradient, distance, and position of each climb throughout a stage. These cover over 300 riders, for nearly 200 unique races, and over 650 different climbs within those races.
Where does power output diverge?
A simple model of a bike race is explained clearly by sports scientist Stephen Seiler in this Youtube video. Over the course of the race, riders raise the level of the race by raising power output. This steadily winnows the pack down. In a very selective race it may winnow down to 1 or 2 riders; in a less selective race you may go to the line with most of the peloton remaining. In the case of the 2020 World Championship Road Race in the video above, the race was very selective leading to a final group with six of the best riders in the world.
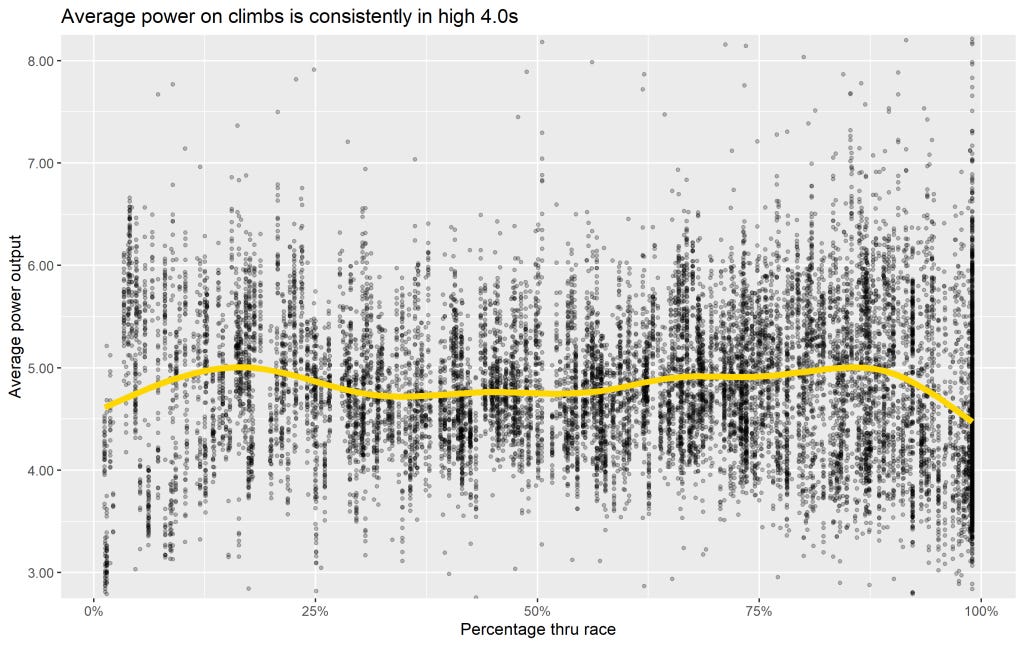
Exploiting these power files, we can draw a curve of the power required throughout the average stage. Interestingly, the curve does not follow this simple model of steadily increasing power. There's a spike in the first quarter of the race where presumably the breakaway is being established, but power declines in the last 20 percent of the race.
However, this does not invalidate Seiler's point as this graph considers all riders in the peloton. Of course, as riders are shed by the peloton because they cannot maintain the steadily increasing pace, they drop their power output and continue on to the finish at some lower pace. This is best illustrated by the gruppetto concept in stage races; each rider doesn't struggle to the finish at the best pace they can maintain. Instead, they are happy to reduce their power output and save their energy for another day.
When I re-create the chart above only stratified into riders finishing top 10, 11-25, 26-50, and 51-100, we see a clear divergence in power over the course of a race. And for those in the top 10 we see a steadily increasing curve from around 4.80-5.00 watts/kg in the first half of the race to about 6.00 watts/kg in the final stages. For riders finishing outside the top 100 we see a steady decline in power output from again around 4.70 to 4.80 watts/kg in the first half to around 4.20 watts/kg in the final stages.

That divergence really appears around 60-70% through the race. Riders in the top 50 but not top 25 can hang on until around 65% through the race, while riders in the top 25 but not top 10 can stick until about 80% through. Of course, nothing is ever this cut and dried considering different parcours with more or fewer climbs, but this gives an idea of the averages across pro races.
Power output by rider type
Leveraging the rider cluster types introduced here and further discussed here we can draw similar curves for six basic rider types. You can see three clear groups: climbers, mountain helpers/puncheurs, and sprinters/sprint train/domestiques. These shows obvious trends where non-climbers are declining in power in the last third of the race and climbers are increasing in power over that time.

Implications
Most interesting is how this model can be applied to identify the toughest obstacle for a rider in a race. A lot of cycling commentary focuses around whether certain riders can overcame a tough climb with the final group - often because that rider has a faster sprint and will beat those riders if they can stick around. These findings can be applied to identify where that most critical obstacle to overcome is located within a race.
To do so, we have to establish a baseline level of power output. This should not be the average level or the level maintained by the peloton at the start of the race, but instead some lower level that is theoretically the floor for a rider in the World Tour/Pro Conti peloton. I would propose using that roughly 4.00 watts/kg level that riders outside the top 100 finishers maintain in closing stages of a race.
We can then scale power outputs relative to that baseline 4.00 watts/kg level. To stick with the final group we can look at what is required for top 10 or top 25 finishers on final climbs. On average, this is in excess of 5.50 watts/kg up to 6.00 watts/kg. This is about 1.5-2.0 watts/kg higher than our baseline. We can also look at what is maintained by riders in the first half to two thirds of the race. That 4.70-4.80 watts/kg level is about 0.7-0.8 watts/kg higher than our baseline. To bring it all together, the curve below approximates the power required to get over the average climb with the lead group based on that climb's position within the race - all scaled relative to a final climb.
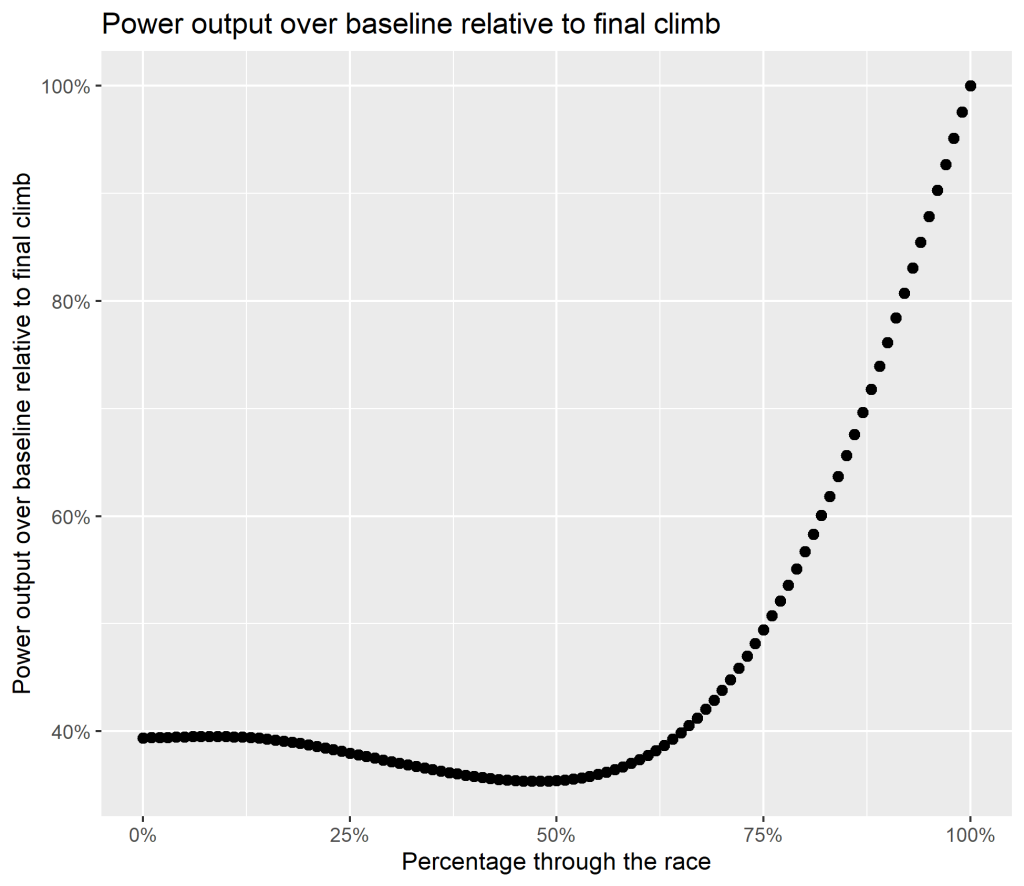
We can see the first 60% of the race or so requires about 35-40% of the power over baseline compared to the final climb. This increases steadily then from that point. The first 25% is likely slightly higher as the breakaway is established here in many races.
An example from 2019 Il Lombardia is shown below with climb difficulty estimates for each climb. These climbing difficulties are based on gradient, distance, and elevation of each climb so that a typical category 1 climb in a grand tour is around 10.0 and a typical category 2 climb in a grand tour is around a 5.0.

Lombardia had six climbs in 2019, two of the 1st category difficulty, three of 2nd category difficulty, and one of the third category difficulty. However, because of how the easiest climb (Battaglia) was placed in the race, it was likely to require more power to overcome than the three 2nd category climbs in the first 180 km. The Sormano climb is the objectively tougher climb without considering position compared to Civiglio or others, but Civiglio's later position in the race makes it a much more equal comparison.